Complete oil price timeline from the 1970s to today. Learn about Brent crude, WTI prices, OPEC, major oil crashes, booms, wars, inflation, and future market trends.
Introduction
Oil has shaped the global economy for more than a century. It powers cars, trucks, airplanes, factories, ships, and power plants. It also serves as a key ingredient in plastics, chemicals, fertilizers, and many everyday products.
Because oil is so important, changes in its price affect almost every country. A sharp rise in crude oil prices can increase transportation costs, push up inflation, and reduce consumer spending. A sudden drop can hurt oil-producing nations while benefiting countries that import energy.
Understanding the oil price timeline helps investors, businesses, students, and policymakers understand how economics, politics, and global events influence markets.
What Is Crude Oil?
Crude oil is an unrefined fossil fuel found underground. It is extracted through drilling and later refined into products such as:
- Gasoline
- Diesel fuel
- Jet fuel
- Heating oil
- Lubricants
- Petrochemicals
- Asphalt
Crude oil is traded globally and priced in U.S. dollars. Daily prices fluctuate based on supply, demand, inventories, geopolitical events, weather, and investor expectations.
Why Oil Prices Matter
Oil prices influence much more than the energy industry.
Consumers
Higher oil prices often lead to:
- More expensive gasoline
- Higher airline ticket prices
- Increased shipping costs
- Rising food prices
Businesses
Companies pay more for transportation, manufacturing, and logistics when energy costs rise.
Governments
Energy prices affect inflation, trade balances, tax revenue, and economic growth.
Investors
Oil prices can influence:
- Energy stocks
- Airline shares
- Transportation companies
- Inflation-linked assets
- Commodity funds
- Currency markets
Understanding Brent Crude and WTI
The two most widely followed oil benchmarks are:
Brent Crude

Brent comes primarily from fields in the North Sea and serves as the international benchmark for much of the world’s oil trade.
West Texas Intermediate (WTI)
WTI is produced mainly in the United States and serves as the benchmark for U.S. crude oil markets.
Although Brent and WTI often move together, transportation constraints and regional supply conditions can create temporary price differences.
How Oil Prices Are Determined
Several forces shape crude oil prices every day.
Supply
Supply depends on:
- OPEC production
- U.S. shale output
- Political stability
- Weather events
- Sanctions
- Natural disasters
Demand
Demand increases when:
- Economies grow
- Manufacturing expands
- Travel rises
- Industrial production strengthens
Inventories
Large oil stockpiles may reduce prices, while shortages can push prices higher.
Currency Movements
Because oil is generally traded in dollars, exchange rates also affect global demand.
Financial Markets
Hedge funds, commodity traders, and institutional investors influence short-term price movements through futures markets.
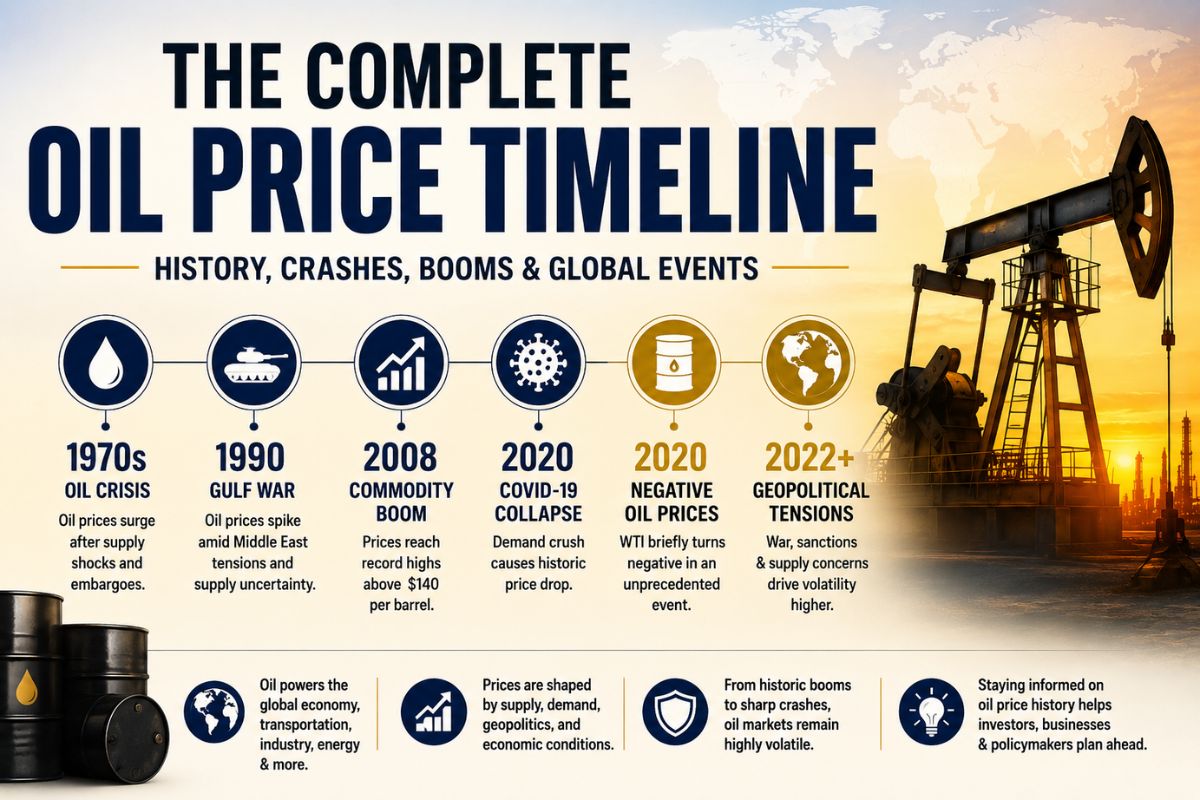
Oil Price Timeline
Before the 1970s
For decades after World War II, oil prices remained relatively stable. Production growth and expanding global trade helped keep markets supplied.
However, geopolitical risks would soon reshape the industry.
1973–1974: The Oil Embargo
One of the most important events in energy history occurred during the Arab oil embargo.
Several oil-exporting countries reduced supplies following conflict in the Middle East, creating shortages across many importing nations.

Market impact
- Oil prices surged.
- Fuel shortages appeared.
- Long lines formed at gas stations.
- Inflation accelerated.
- Governments introduced energy-saving measures.
The crisis demonstrated how geopolitical events could rapidly affect global markets.
1979: Iranian Revolution and Second Oil Shock
Political unrest in Iran disrupted production and exports.
Although the actual supply reduction was smaller than many feared, uncertainty triggered another major price increase.
Consumers and businesses once again faced rising fuel costs.
The event reinforced the importance of energy security and strategic petroleum reserves.
1986: Oil Price Collapse
By the mid-1980s, production increased while demand weakened.
Saudi Arabia changed its production strategy, leading to a large increase in supply.
Prices fell dramatically, creating financial stress for many producing nations while lowering costs for consumers.
1990–1991: Gulf War Effects
The invasion of Kuwait raised concerns about oil supplies from the Middle East.
Markets reacted immediately, sending prices sharply higher.
As military operations progressed and production resumed, prices stabilized.
The episode highlighted how geopolitical uncertainty alone can move commodity markets.
1997–1998: Asian Financial Crisis
Economic slowdowns across several Asian economies reduced oil demand.
Combined with growing supply, weaker consumption caused prices to decline substantially.
Many exporting countries experienced lower revenues during this period.
2003–2007: Commodity Supercycle
Rapid industrialization and economic growth, particularly in emerging markets, increased energy demand.
China’s expanding manufacturing sector became one of the largest drivers of global oil consumption.
Prices climbed steadily as investors anticipated continued growth.
2008: Record Highs and Historic Crash
Oil reached record levels during the commodity boom, driven by strong demand and market optimism.
Later that year, the global financial crisis sharply reduced economic activity.
Travel slowed.
Factories reduced production.
Demand weakened.
Oil prices collapsed within months, illustrating how quickly markets can reverse.
2014–2016: U.S. Shale Revolution
Technological advances enabled American producers to increase shale oil production significantly.
The resulting supply growth exceeded demand growth.
Prices dropped sharply, forcing many producers to cut spending and delay projects.
Consumers, however, benefited from lower fuel prices.
2020: COVID-19 and Negative Oil Prices
The COVID-19 pandemic caused one of the largest demand shocks in history.
Lockdowns reduced travel worldwide.
Airlines grounded flights.
Road traffic declined.
Factories slowed production.
Storage facilities filled rapidly.
In April 2020, a historic event occurred when certain WTI futures contracts briefly traded below zero because holders were willing to pay others to take delivery due to storage constraints.
This unprecedented situation reflected futures market mechanics rather than consumers being paid to fill their cars with gasoline.
2021: Economic Recovery
As economies reopened, transportation activity recovered.
Demand rebounded faster than supply in many regions, pushing prices upward.
Energy companies gradually increased production while supply chains adjusted.
2022: Russia-Ukraine War
The conflict involving Russia and Ukraine created significant uncertainty in global energy markets.
Russia is one of the world’s largest oil exporters.
Sanctions, trade disruptions, and concerns about supply contributed to price volatility.
Many countries sought alternative energy sources and diversified imports.
Middle East Tensions Continue to Influence Markets
Political instability in major producing regions continues affecting investor expectations.
Even when physical supplies remain adequate, uncertainty can increase prices because traders prepare for possible disruptions.
Shipping routes, production facilities, and diplomatic developments remain closely monitored.
OPEC and OPEC+ Decisions
The Organization of the Petroleum Exporting Countries (OPEC) coordinates production policies among member nations.
OPEC+, which includes additional major producers, often adjusts output targets in response to market conditions.

Production cuts generally aim to support prices by reducing supply.
Production increases may help moderate prices when demand strengthens.
Markets closely watch every meeting because announced quotas can influence expectations immediately.
Oil Prices and Inflation
Energy costs affect nearly every sector of the economy.
When crude oil prices rise:
- Transportation becomes more expensive.
- Manufacturing costs increase.
- Shipping prices climb.
- Airline expenses rise.
- Food distribution becomes costlier.
These higher costs may contribute to broader inflation.
Conversely, declining oil prices can ease inflationary pressure over time.
Oil Prices vs. Gasoline Prices
Many people assume crude oil and gasoline prices move together perfectly.
In reality, gasoline prices also depend on:
- Refining capacity
- Taxes
- Distribution costs
- Seasonal demand
- Local regulations
- Retail competition
Still, crude oil remains one of the largest drivers of fuel prices over the long run.
Historical Oil Market Milestones
| Year | Event | Market Impact |
|---|---|---|
| 1973 | Arab Oil Embargo | Sharp price increase and fuel shortages |
| 1979 | Iranian Revolution | Second major oil shock |
| 1986 | Supply surge | Significant price decline |
| 1990 | Gulf War | Temporary spike due to supply concerns |
| 2008 | Commodity boom | Record-high prices before financial crisis |
| 2020 | COVID-19 pandemic | Demand collapse and negative WTI futures |
| 2022 | Russia–Ukraine conflict | Increased volatility and supply concerns |
Brent vs. WTI Comparison
| Feature | Brent Crude | WTI |
|---|---|---|
| Primary Region | North Sea | United States |
| Global Use | International benchmark | U.S. benchmark |
| Typical Delivery | Seaborne | Land-based |
| Main Influence | Global trade flows | U.S. production and storage |
Key Lessons from the Oil Price Timeline
Geopolitics Matters
Wars, sanctions, and diplomatic tensions frequently affect prices.
Supply and Demand Remain Fundamental
Growing demand with limited supply usually supports prices.
Oversupply often pushes prices lower.
Markets Can Change Quickly
Events such as pandemics or financial crises demonstrate how rapidly expectations can shift.
Diversification Is Important
Investors should avoid relying solely on one commodity or sector.
Table of Contents
Future Outlook
Several long-term trends may influence future oil markets:
- Growth in electric vehicles
- Renewable energy adoption
- AI-driven energy efficiency
- Population growth
- Industrial expansion
- OPEC production strategy
- U.S. shale development
- Global economic growth
- Climate policy changes
Despite the transition toward cleaner energy, oil is expected to remain an important part of the global economy for years because transportation, manufacturing, aviation, and petrochemicals continue relying heavily on petroleum products.
Read More Related
Annual Stock Market Report 2026 | S&P 500, Dow & Nasdaq Review
Beginner Investing Guide: How to Start Investing in 2026
What is the oil price timeline?
It is the historical record of major crude oil price movements and the events that influenced them, including wars, economic crises, supply disruptions, and policy changes.
Why did oil prices become negative in 2020?
Certain WTI futures contracts briefly traded below zero because storage capacity was limited and traders sought to avoid taking physical delivery during an unprecedented demand collapse.
What is the difference between Brent and WTI?
Brent is an international benchmark primarily linked to North Sea production, while WTI is the leading U.S. benchmark and reflects domestic crude markets.
Does OPEC control oil prices?
OPEC does not directly set prices, but its production decisions can significantly influence global supply and market expectations.
Source . U.S. Energy Information administration

Business & Economy Editor
James focuses on global business developments, mergers and acquisitions, international trade, and economic policy. His reporting provides context behind major corporate decisions and their impact on industries, markets, and consumers around the world.
Discover more from Wall Street Sights
Subscribe to get the latest posts sent to your email.